Multi-Scale Dataset
Description of the COVID-19 multi-scale dataset and download links
More ›

Graph and Server-API
Description of the multi-scale graph structure and server API
More ›
Visualization Dashboard
Description of the interactive visualization dashboard
More ›
The Coronavirus Disease (COVID-19) continued to strike as a highly infectious and fast-spreading disease in 2020 and 2021. As the research community took active responses to this pandemic, an outstanding effort that cannot be neglected is the release of a number of COVID-19-related datasets and visualization dashboards. However, existing resources are insufficient to support multi-scale and multi-faceted modeling or simulation, which is suggested to be important by the computational epidemiology literature. The goal of our work is to fill in this gap. Toward this goal, we present a curated multi-scale geospatial dataset with an interactive web-based visualization dashboard under the context of COVID-19. This open dataset will allow researchers to conduct numerous projects or analyses relating to COVID-19 or simply geospatial-related scientific studies. The interactive visualization platform enables users to visualize the spread of the disease at different scales (e.g., from the country level to individual neighborhoods), and allows users to interact with the policies enforced at these scales (e.g., the closure of borders and lockdowns within communities) to observe their impacts on the epidemiology.

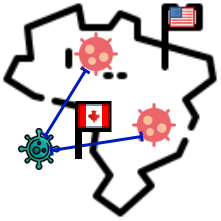
Fig. 1: A preliminary prototype of multi-scale interactive platform with visualization of infection spread in New Jersey. The different components in the figure reflect user interactivity with the system. The red circles represent different nodes, whereas the lines represent the connections between the nodes in the network. The size of the disks relates to disease exposure in these nodes.